clearPath Report Builder: Design Your Own Reports
clearPath has always shipped with a deep catalogue of ready-made reports — compliance by unit, by moment, by provider, certificates, trends, and dozens more. But every infection prevention and quality team eventually runs into the same wall: the report they need that day is almost on the list, but not quite. A column in a different order. One extra filter. A chart instead of a table, or a table instead of a chart. Until now, that meant exporting to a spreadsheet and rebuilding it by hand every month.
The new Report Builder closes that gap. It lets you design your own report — point, click, and watch a live preview redraw beside you — and when you save, it joins the rest of your reports as a first-class citizen: it refreshes overnight, runs on demand, and can be emailed or bundled into a distribution list just like any built-in report. There is nothing to install and no query language to learn.
Design on the Left, Preview on the Right
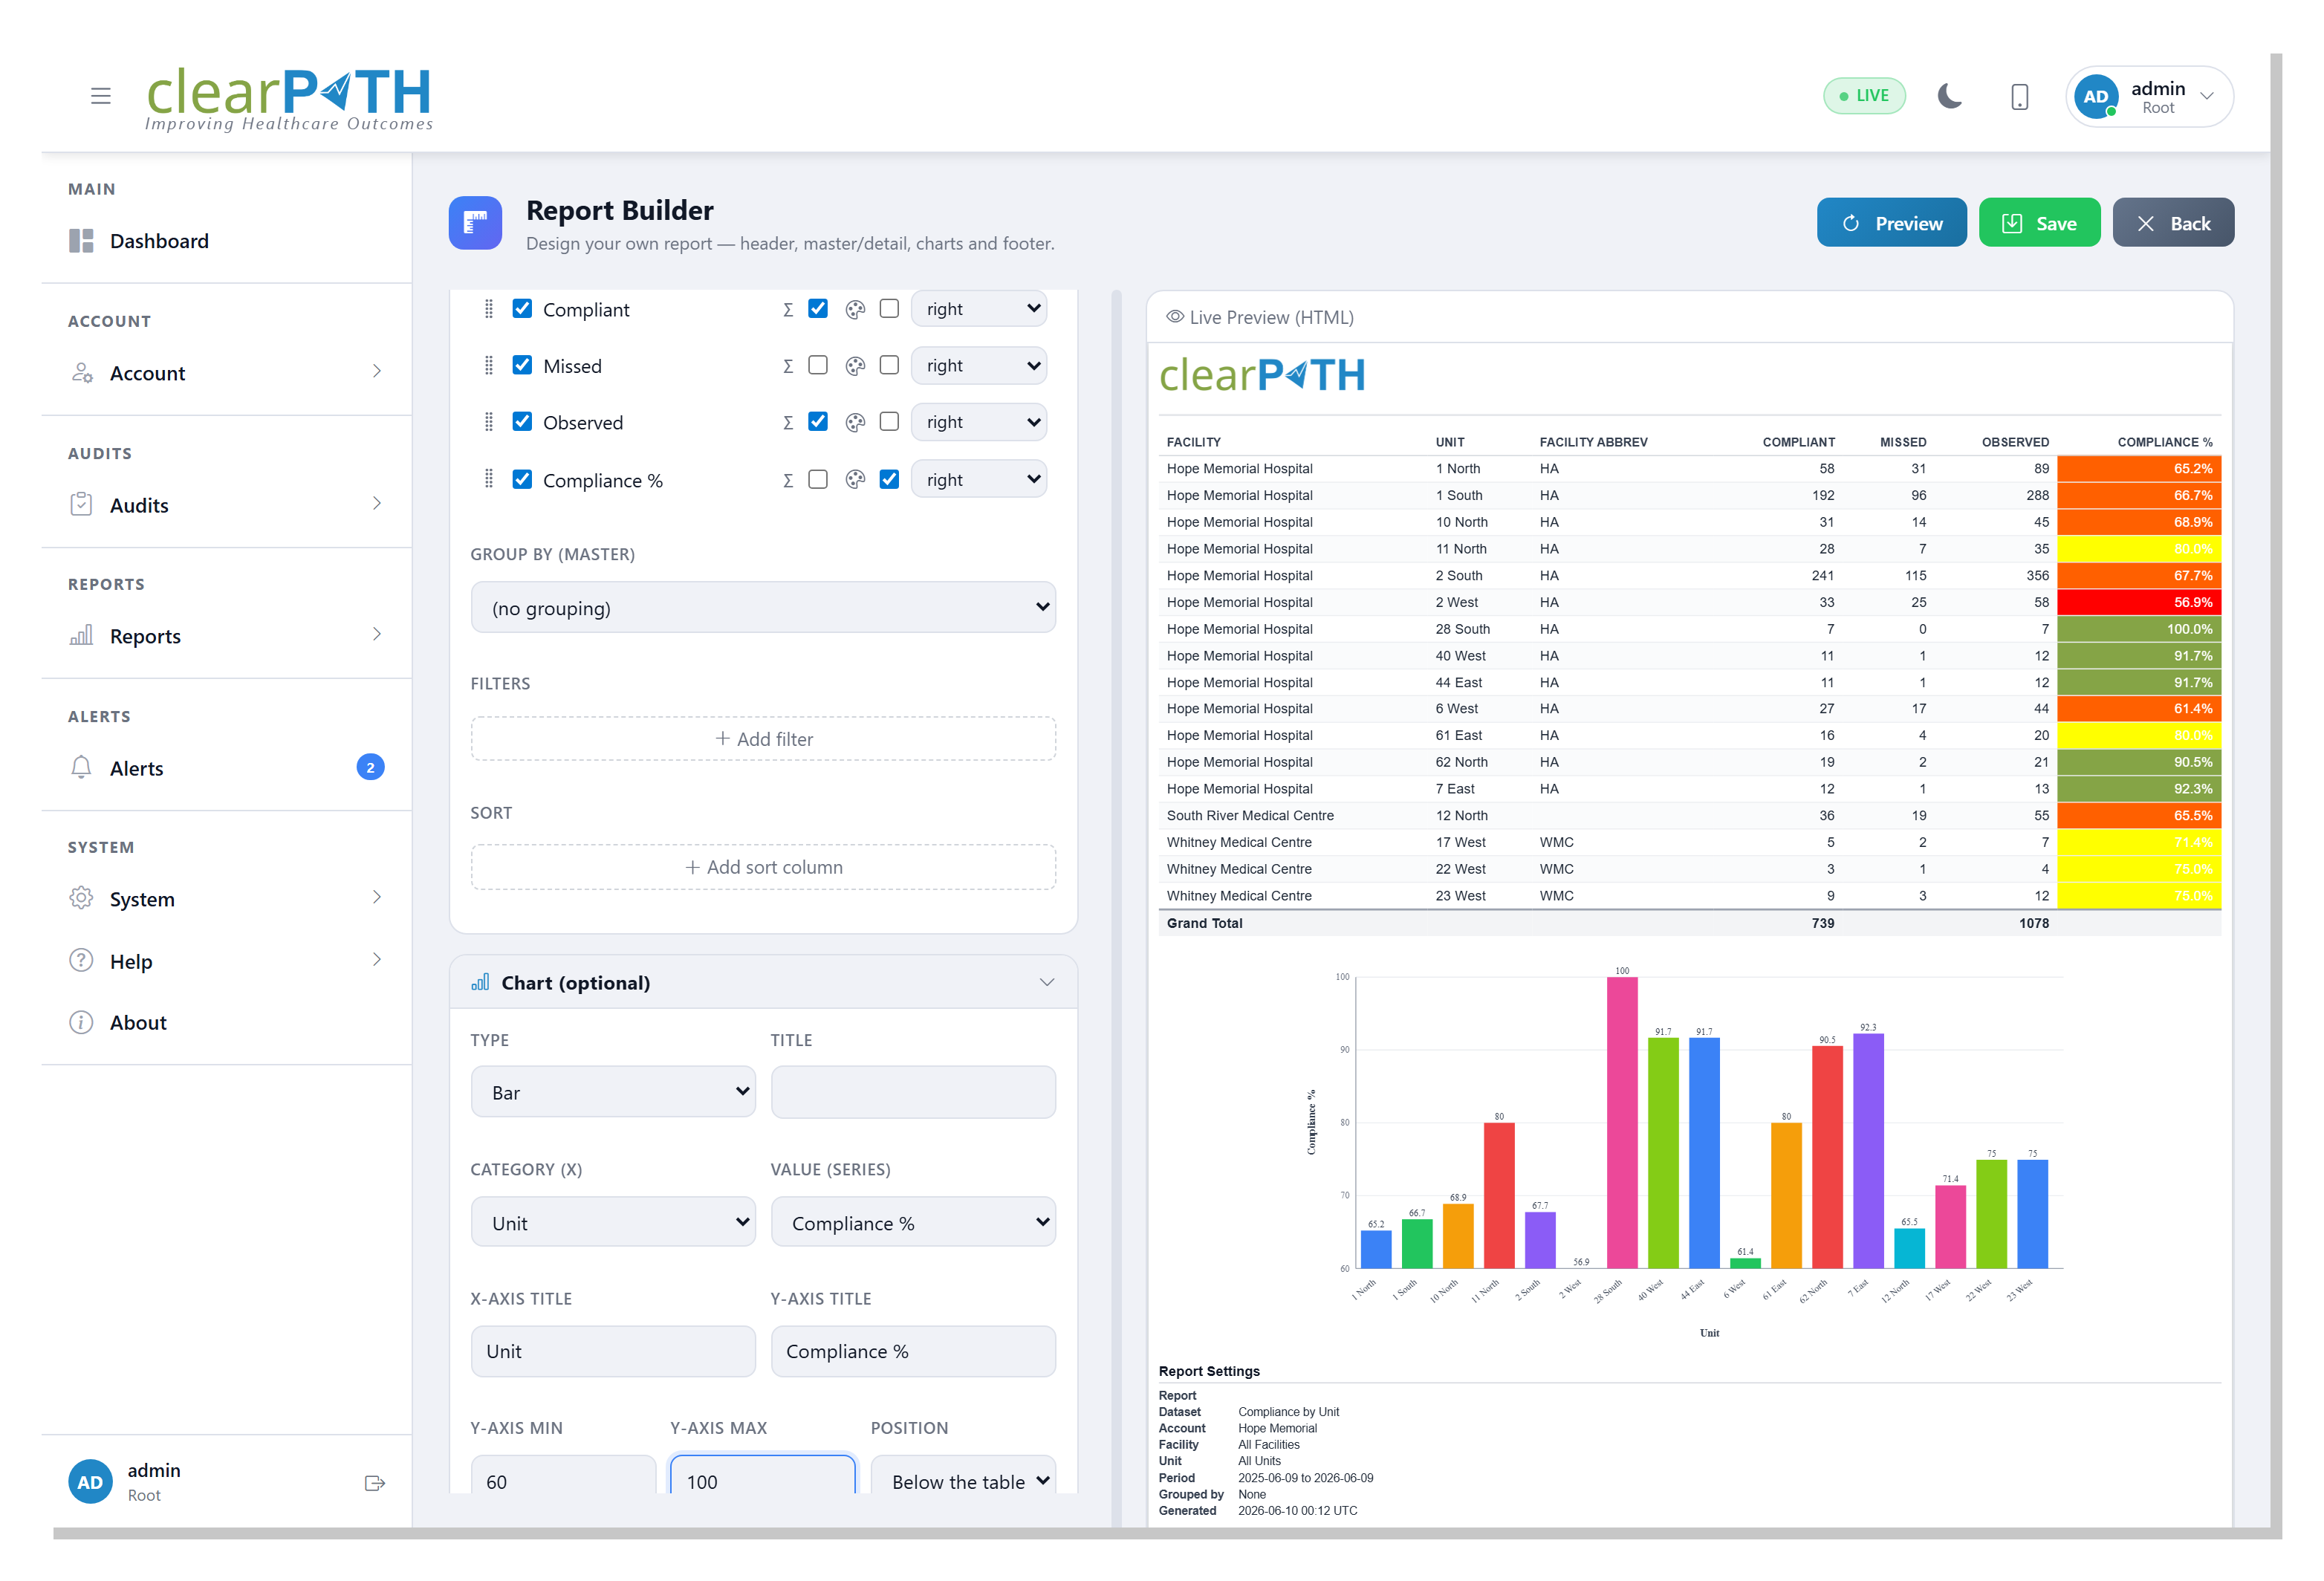
The builder divides the screen in two. On the left are collapsible design panels — General, Scope & Period, Header, Data, Chart, and Footer — so you can focus on one part of the report at a time. On the right is a live preview that re-draws with every change you make and scales to fit, so a full page is always in view without a sideways scroll. Drag the divider to give the design panels or the preview more room.
Set a dynamic time period such as Last 12 Months and the report always covers a rolling window, not a date you have to keep editing. Choose landscape or portrait, and pick your output format — the preview reflects your choices as you go, so you never save blind.
Safe, Ready-Made Data Sources
You start from a dataset — a ready-made, curated view of your own data. There are more than two dozen to choose from, and each one exposes only a fixed set of fields, so sensitive information such as passwords and security keys is never reachable. That is the heart of the design: you assemble reports from safe building blocks, and every dataset is automatically scoped to your own account.
Tick the columns you want, drag them into the order you want, and set each one's alignment. Datasets span the things a program actually reports on:
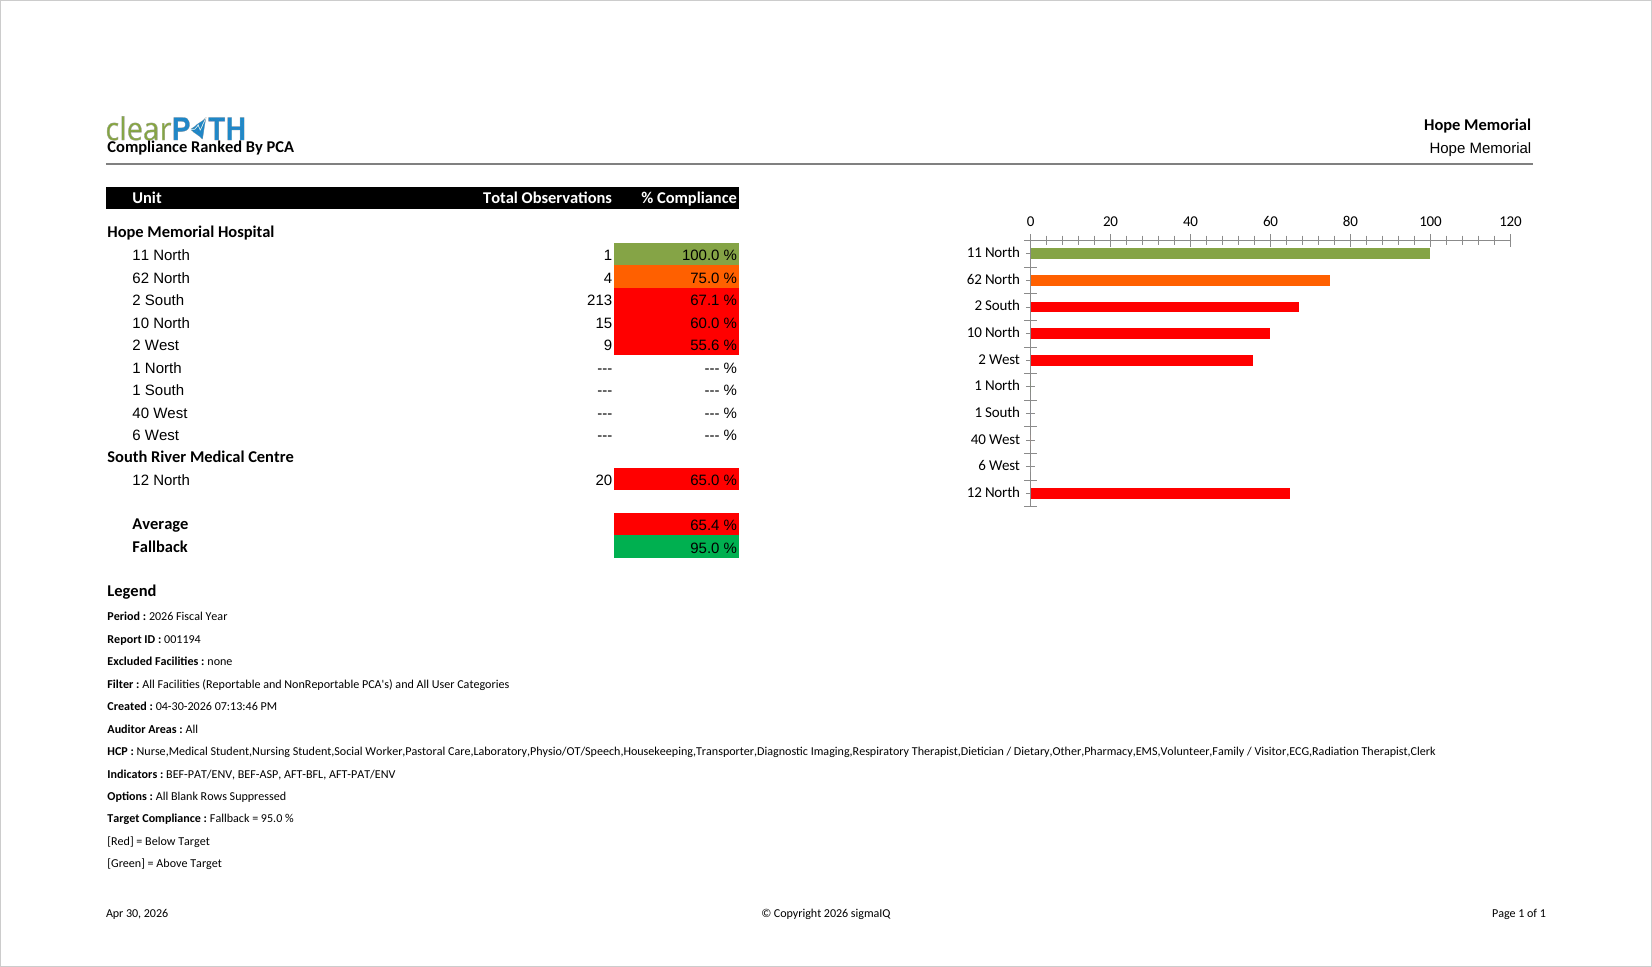
- Compliance by unit, facility, month, Moment, or provider
- Technique distribution and PPE / attribute distribution
- Observer summary and daily observation volume
- Audit sessions, session completeness, and observation detail
- Audit schedules, compliance targets, and inter-rater reliability
- Custom audit results, scores, and category scores
- Users, roles, facilities, units, providers, and auditing devices
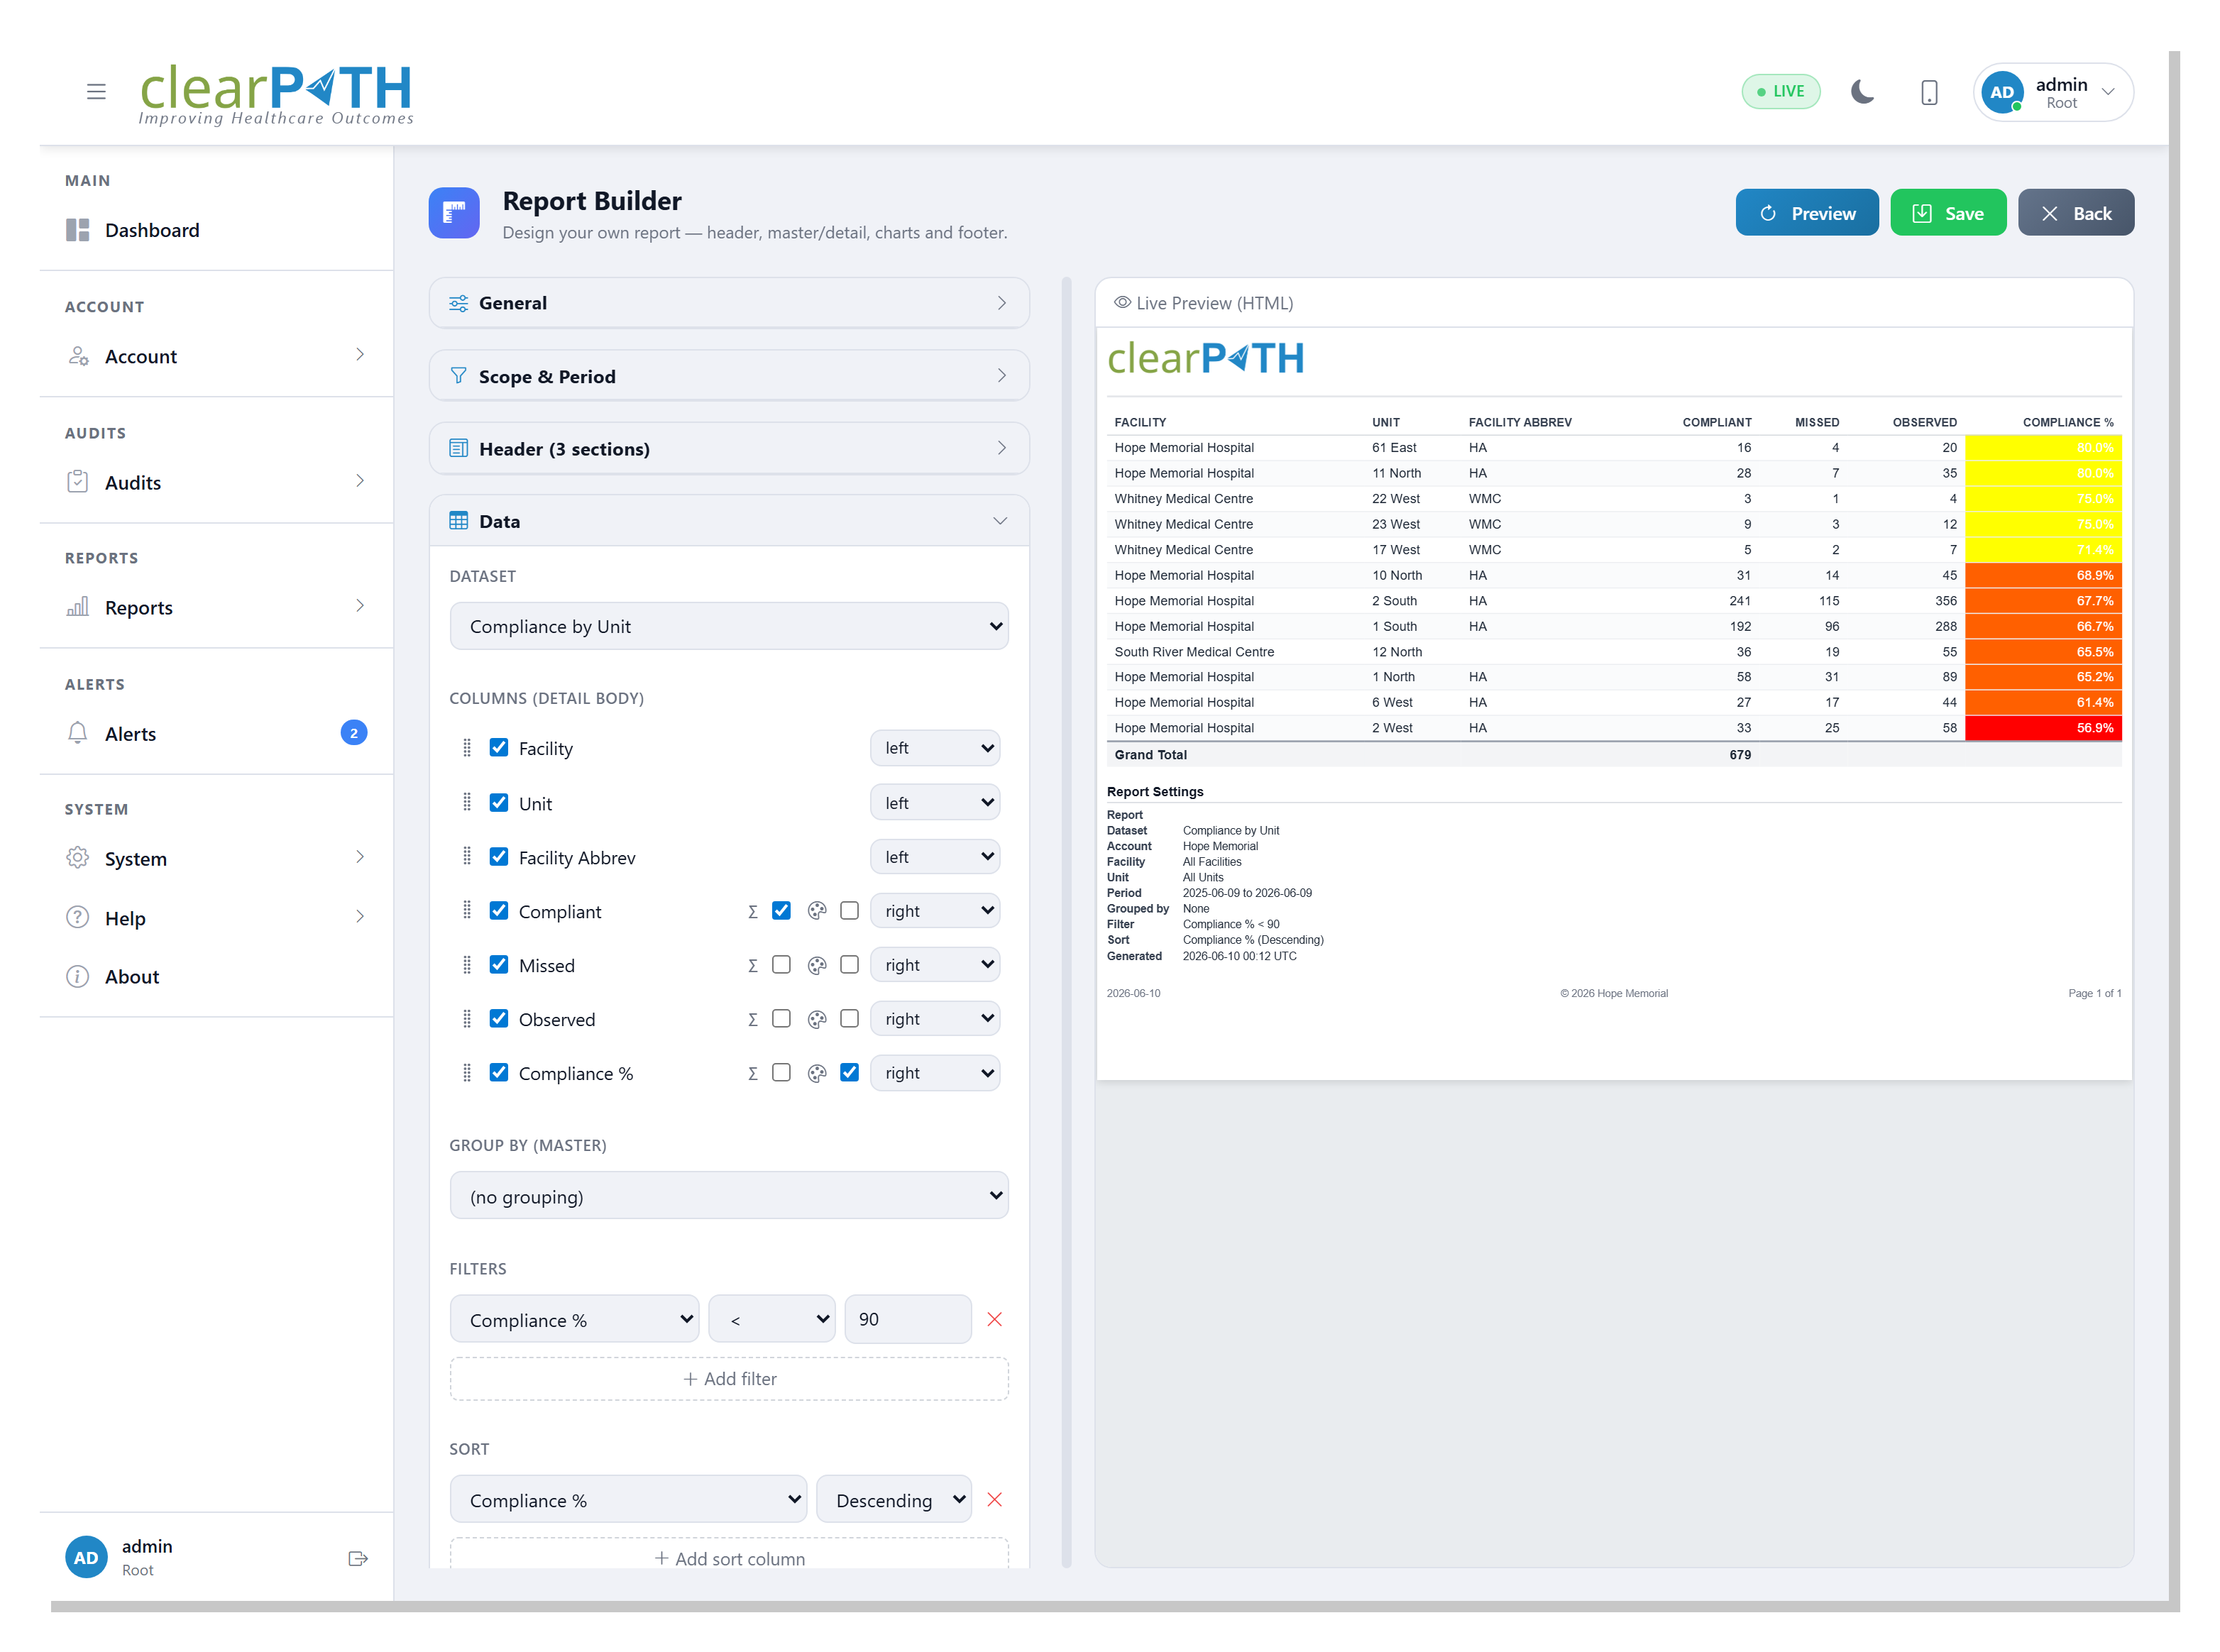
Filter, Sort, Total, and Colour
A raw table is only the starting point. Narrow a report to exactly what matters with filters such as compliance below 90% or provider is Nurse, and order it with multi-column sorting. Turn on totals to add a grand-total row, and a subtotal under each group when you group the rows — for example, units grouped under their facility. Because the same filters apply to the chart, the graph and the table always agree.
Switch on colour for any number column and its cells are shaded by your account's colour ranges — the very same green / amber / red bands you see on the dashboard. A compliance column then reads at a glance: strong results in green, weak ones in red, consistent with the rest of clearPath.
A Finished Report, Ready to Share
Every report can carry a three-section header and footer. Type any text, drop in tokens that fill themselves in — the report name, your account, the facility, the date — and switch on your account logo. Add a bar, line, or pie chart above or below the table, give it axis titles and a fixed value range, and finish the footer with a date, a copyright line, and an automatic Page X of Y counter.
PDF and Excel output is laid out for printing. The logo, header, column headings, and footer repeat at the top and bottom of every page, the table is sized to fill the width of the page, and when you group the rows each group starts on a fresh page — so a long report reads cleanly from the first page to the last. Each report can also finish with a tidy settings summary: the data source, the scope, the time period, every filter and sort, and how the rows are grouped — a clear record, for whoever receives it, of exactly what they are looking at.
Tables, Charts, or Both
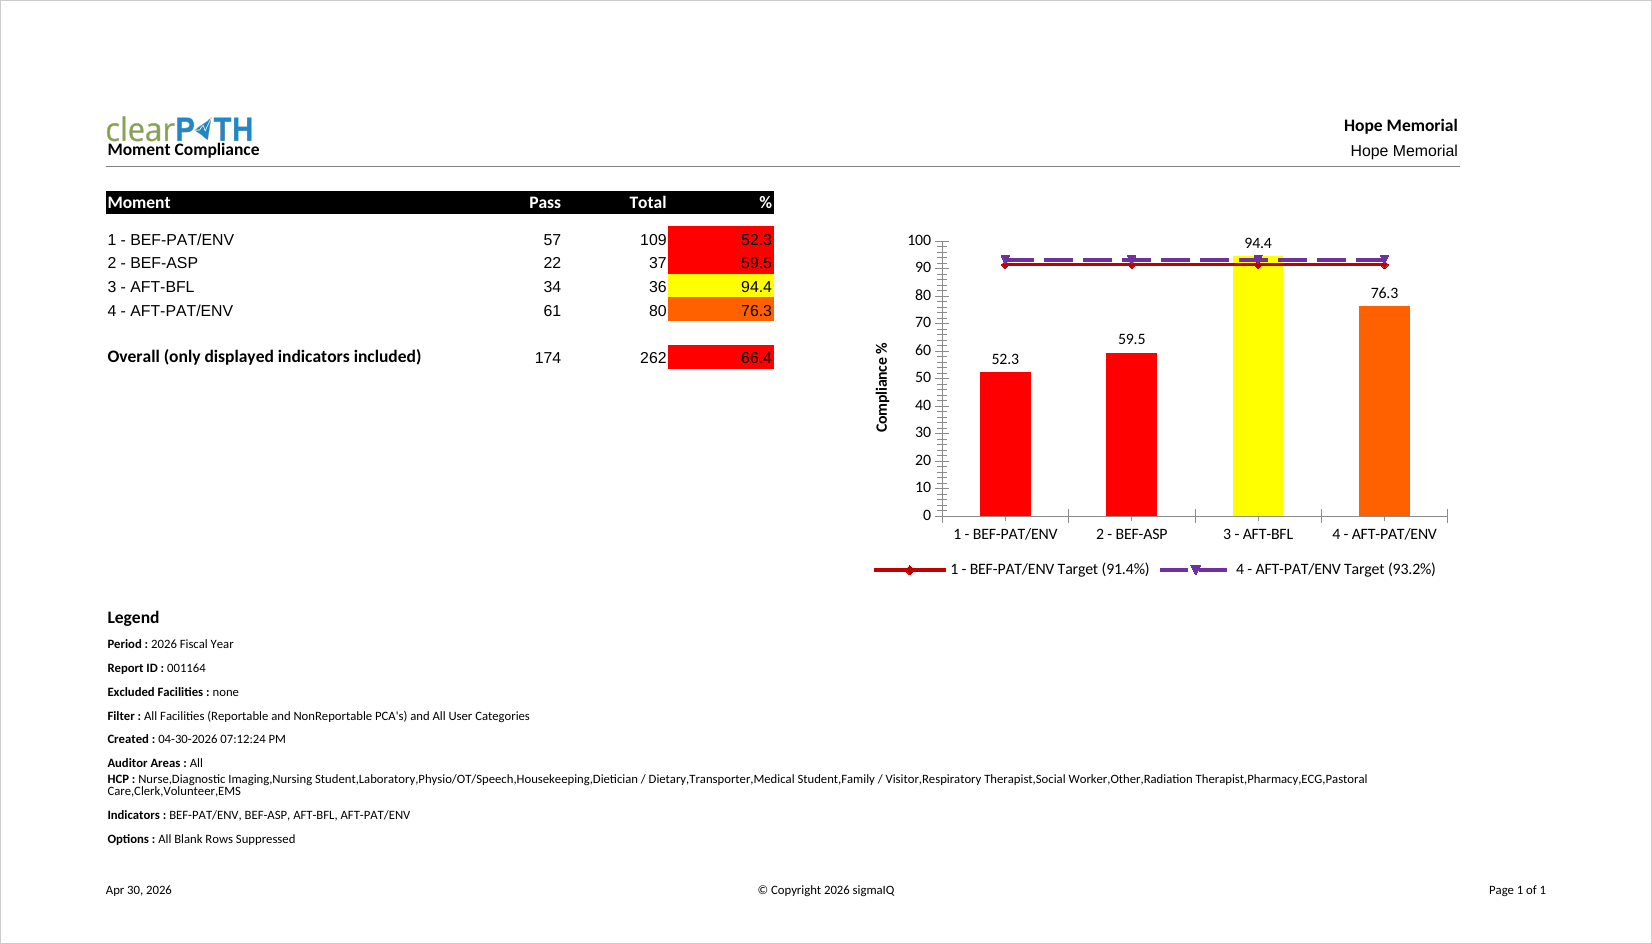
Because the chart and the table are driven by the same dataset and the same filters, you can lean on whichever tells the story best. A compliance-by-moment report can pair a colour-coded table with a column chart and target lines, so a reader sees both the precise numbers and the shape of the problem in a single glance. Move the chart above the table for a one-look summary, or below it for detail-first readers — the choice is a single setting.
And none of this is a throwaway export. A report you build is listed and managed alongside all your other reports, refreshes on the normal overnight schedule, runs on demand, refreshes the moment you save it, and can be added to a distribution list for automatic email or secure file delivery. Re-open it in the builder any time to refine it.
Who It's For
The Report Builder is built for the person who knows their program better than any template author ever could — the infection preventionist who wants units ranked their way, the quality lead who needs one extra filter for an accreditation binder, the analyst who would rather click than rebuild a spreadsheet every month. If you have ever exported a clearPath report just to rearrange it, this is the feature that ends that chore for good.
Design Your First Report
The Report Builder is available on the clearPath Ultimate edition. Compare what each edition includes, or request a personalized walkthrough using your own facility structure.
Compare Editions Request for InformationWant the full picture of what shipped this quarter? See What's New in clearPath: The Q2 2026 Release.